Research motiviation
Existing research suggests that exposure to air pollution varies precipitously not only across the country, but as predicated on the basis of certain racial/ethnic and income groups.
Project objective
The goal of this webapp is to highlight the aforementioned disparities in a public-facing and accessible medium. We hope this tool will bring an element of personalization to air quality visualization, informing policy outcomes in the process.
Technical overview
Demographic data was sourced from the Decennial Census and combined with predictions of air pollution components generated by a research team at Harvard. The cumulative dataset spans across different levels of geographic granularity.
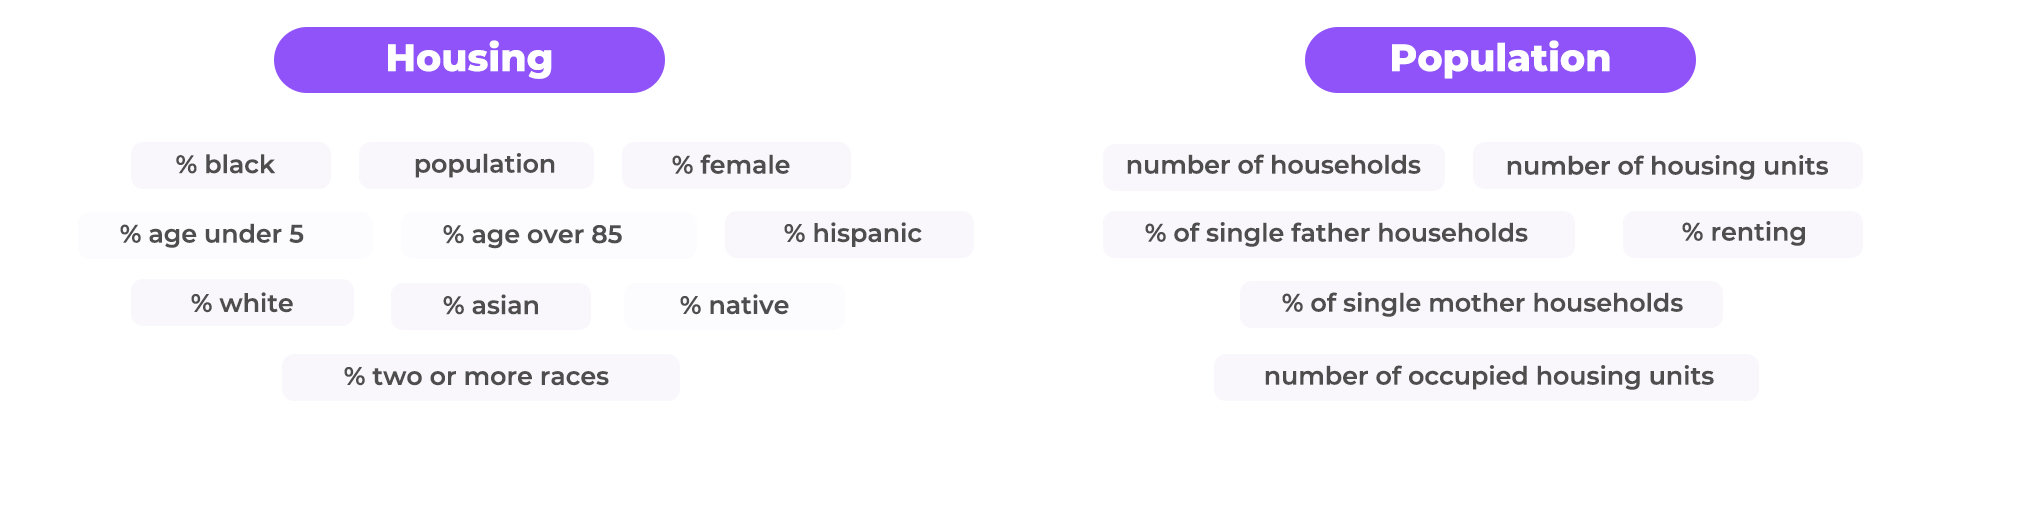
Demographic data is sourced from the US Decennial Census in year 2010. The geographic granularity chosen for analysis in this study is the county-level. Metrics available in the Census center around housing and population, providing insight into research topics such as population changes over time and the percentage of renters in major US cities. This project focuses on a partial subset of all available variables.
When examined in conjunction with air pollution predictions, demographic data can shine a spotlight on the population subgroups disproportionately exposed to air pollution.
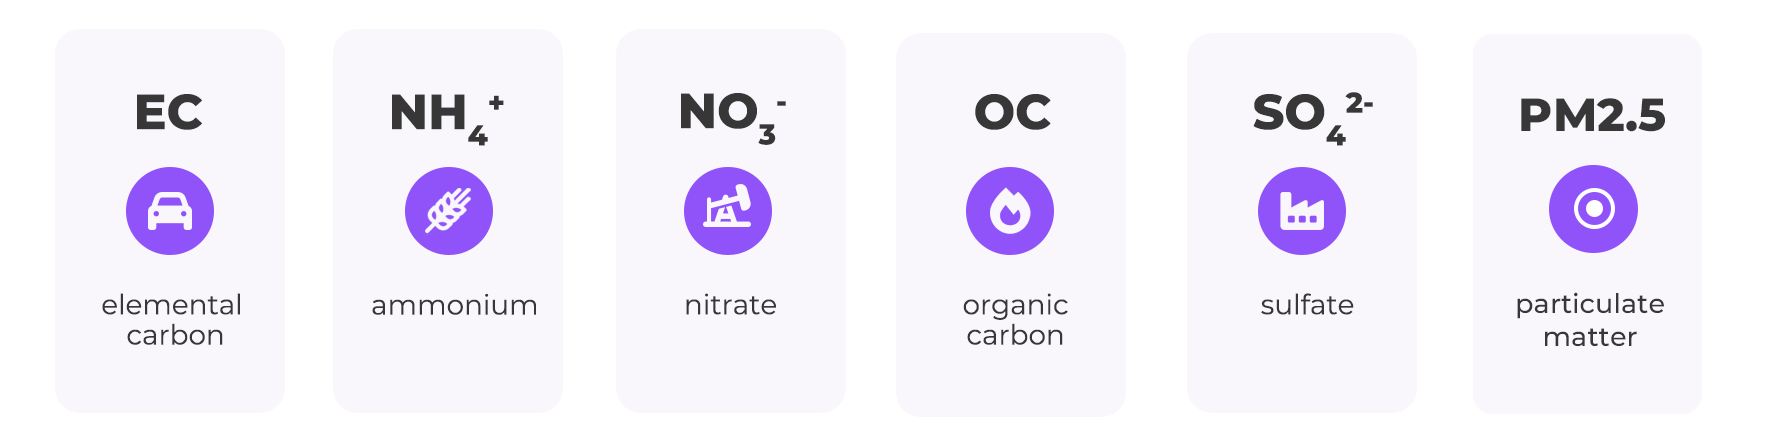
The air pollution predictions used in this study are based on research conducted by the NSAPH group. While PM2.5 is an umbrella measure, the chemicals comprising PM2.5 can be categorized into several subset components. This project focuses on elemental carbon, ammonium, nitrate, organic carbon, and sulfate, with each varying widely in its source. Our tool provides the option to visualize each of such components, along with PM2.5. Disclaimer: While there is enough evidence to suggest that PM2.5 is detrimental to health, more studies are needed to evaluate differential impacts of PM2.5 components.
The underlying dataset is available for download through NASA SEDAC.
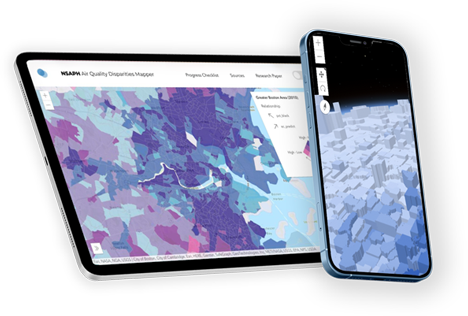
Upon launching the mapper screen, there are a few primary ways to locate a given county: panning around on the underlying basemap using geographic labels as context clues, clicking a data point in the scatterplot menu, and entering a place name into the search bar.
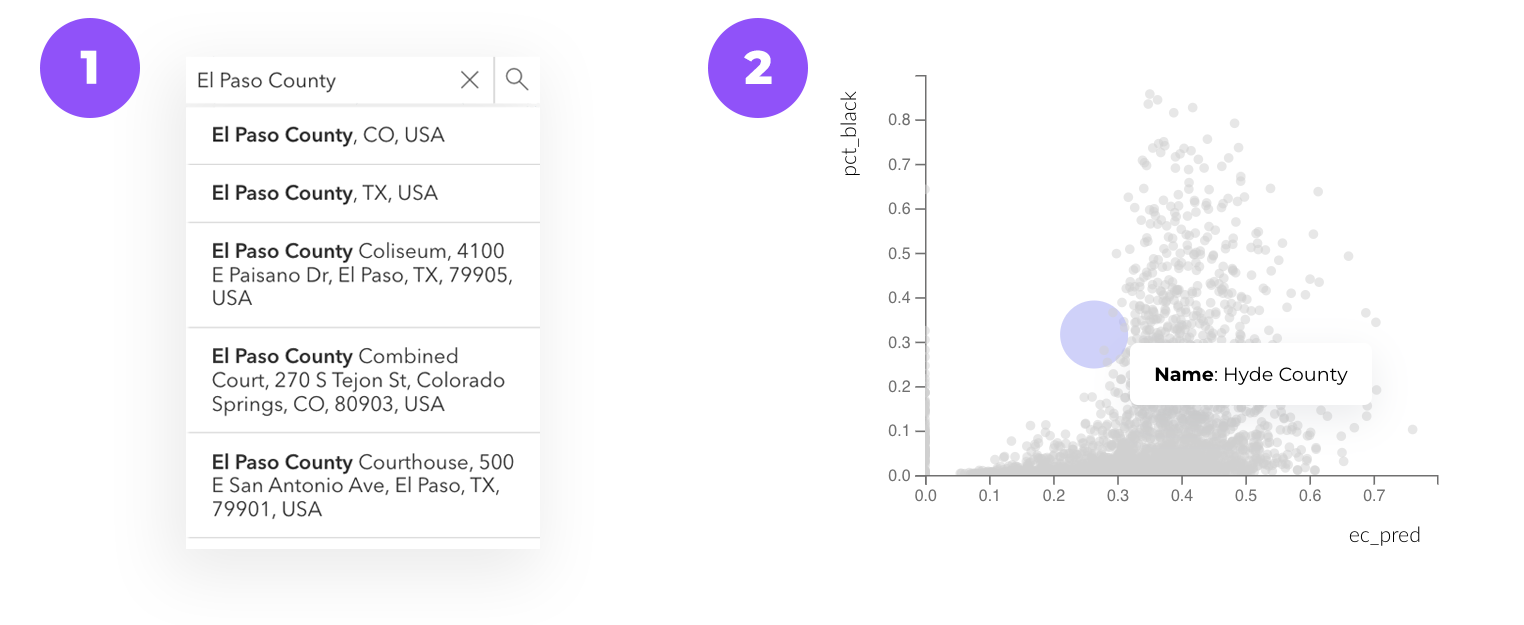
These tools are meant to encourage analysis at a scale that is very localized to the user. Clicking on a given county's geometry will reveal information about its relative standing for the selected demographic and pollution measures.

Ethan McFarlin is an undergraduate at Harvard College studying Computer Science.

Edgar Castro is a PhD student at the Harvard T.H. Chan School of Public Health.

Falco J. Bargagli Stoffi is a Researcher at the Harvard T.H. Chan School of Public Health.

Heresh Amini is an Associate Professor at the Icahn School of Medicine at Mount Sinai.

Francesca Dominici is a Professor at the Harvard T.H. Chan School of Public Health.

Joel Schwartz is a Professor at the Harvard T.H. Chan School of Public Health.